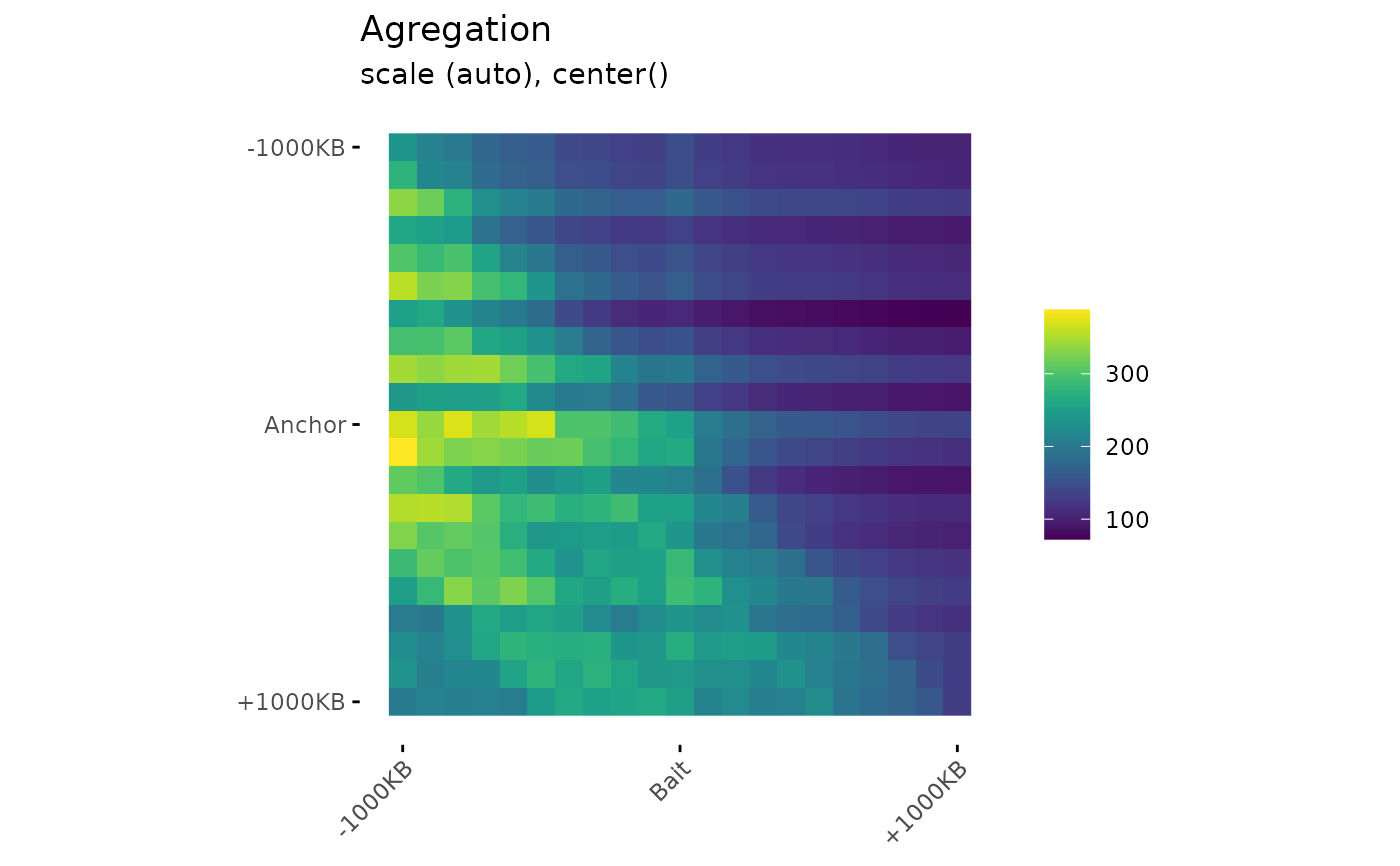
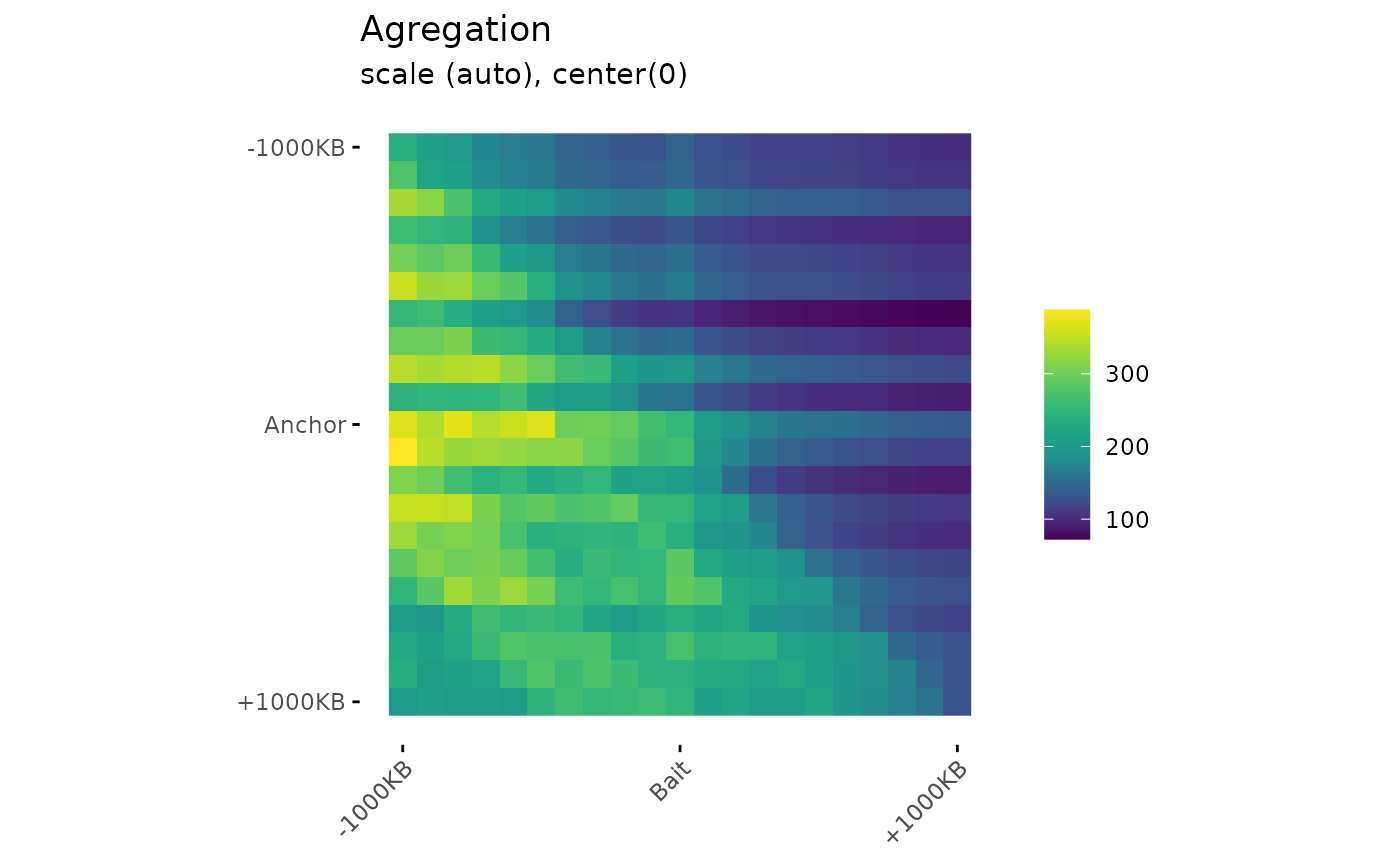
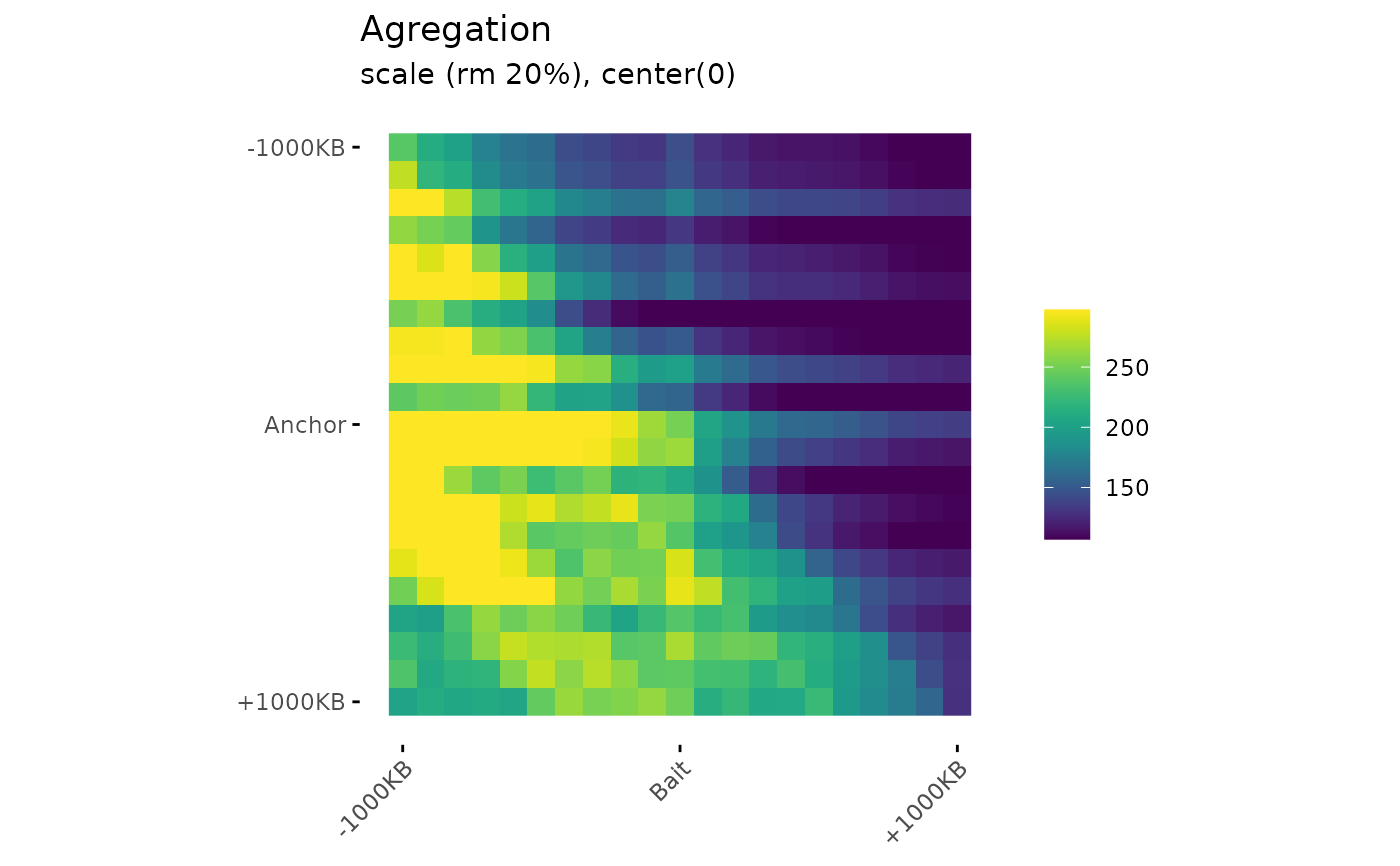
Draw aggregation plot from aggregation matrices.
Usage
PlotAPA(
  aggregatedMtx = NULL,
  trim = 0,
  colMin = NULL,
  colMid = NULL,
  colMax = NULL,
  colMinCond = NULL,
  colMaxCond = NULL,
  extra_info = FALSE,
  ...
)
Arguments
- aggregatedMtx
: The aggregated matrix. - trim
: A number between 0 and 100 that gives the percentage of triming in matrices. - colMin
: The minimal value in color scale. If Null automaticaly find. - colMid
: The middle value in color scale. If Null automaticaly find. - colMax
: The mximal value in color scale. If Null automaticaly find. - colMinCond
: Avalaible for plotting differential aggregation. The minimal value in color scale in the classsical aggregation plot. If NULLautomaticaly find.- colMaxCond
: Avalaible for plotting differantial aggregation. The maxiaml value in color scale in the classsical aggregation plot. If NULLautomaticaly find.- extra_info
do you want to have a recall of your arguments values? (Default FALSE) - ...
additional arguments to
ggAPA()
Examples
# Data
data(Beaf32_Peaks.gnr)
data(HiC_Ctrl.cmx_lst)
# Index Beaf32
Beaf32_Index.gnr <- IndexFeatures(
gRangeList = list(Beaf = Beaf32_Peaks.gnr),
chromSizes = data.frame(seqnames = c("2L", "2R"),
seqlengths = c(23513712, 25286936)),
binSize = 100000
)
# Beaf32 <-> Beaf32 Pairing
Beaf_Beaf.gni <- SearchPairs(indexAnchor = Beaf32_Index.gnr)
Beaf_Beaf.gni <- Beaf_Beaf.gni[seq_len(2000)] # subset 2000 first for exemple
# Matrices extractions center on Beaf32 <-> Beaf32 point interaction
interactions_PF.mtx_lst <- ExtractSubmatrix(
genomicFeature = Beaf_Beaf.gni,
hicLst = HiC_Ctrl.cmx_lst,
referencePoint = "pf"
)
# Aggregate matrices in one matrix
aggreg.mtx <- Aggregation(interactions_PF.mtx_lst)
# Visualization
PlotAPA(
aggregatedMtx = aggreg.mtx
)
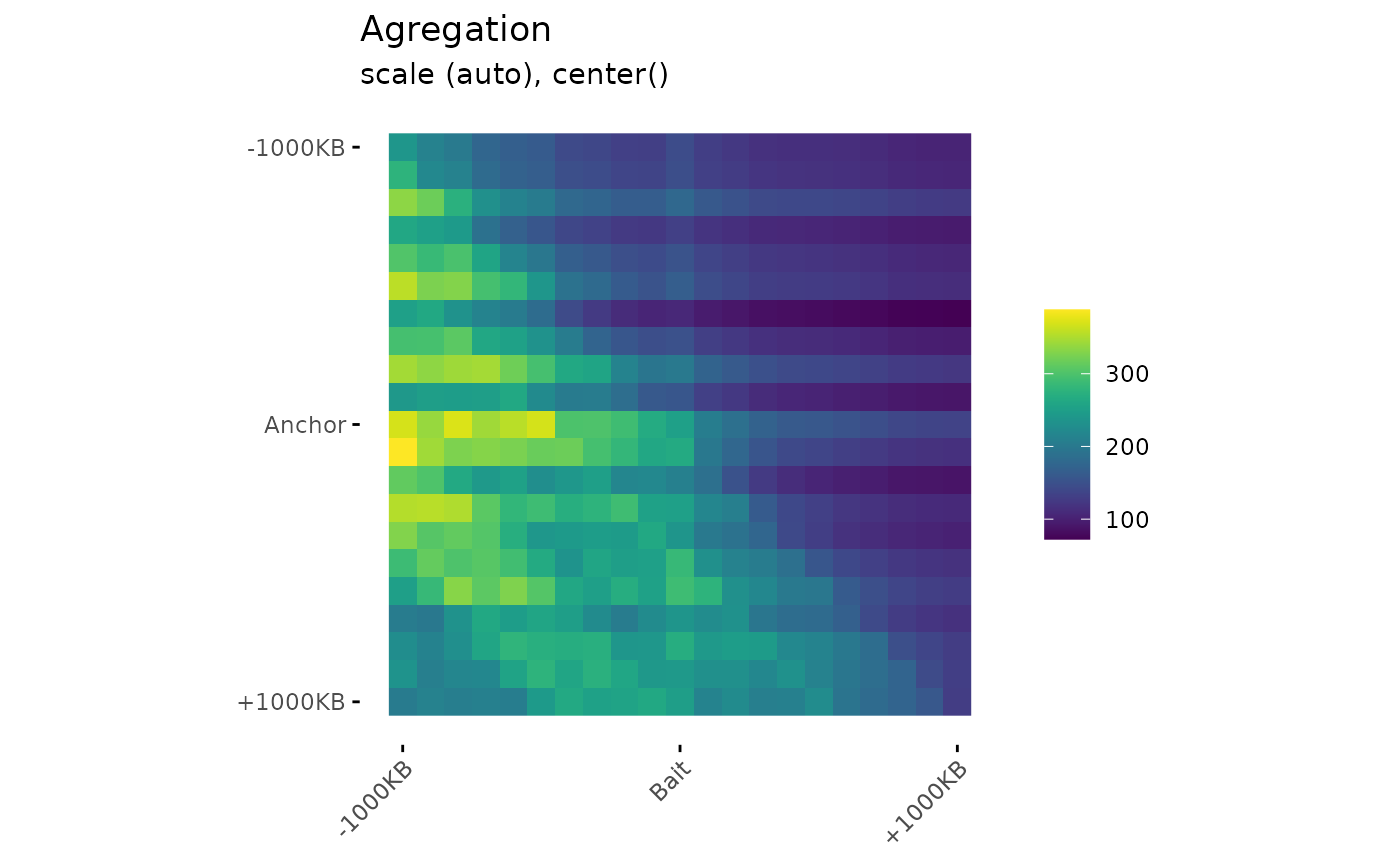 PlotAPA(
aggregatedMtx= aggreg.mtx,
trim= 20,
colMin= -2,
colMid= 0,
colMax= 2,
colMinCond = 0,
colMaxCond = 2
)
