Create a ggplot object used for plot aggregation.
Usage
ggAPA(
  aggregatedMtx = NULL,
  title = NULL,
  trim = 0,
  tails = "both",
  colMin = NULL,
  colMid = NULL,
  colMax = NULL,
  colBreaks = NULL,
  blurPass = 0,
  boxKernel = NULL,
  kernSize = NULL,
  stdev = 0.5,
  loTri = NULL,
  colors = NULL,
  na.value = "#F2F2F2",
  colorScale = "linear",
  bias = 1,
  paletteLength = 51,
  annotate = TRUE,
  anchor.name = "Anchor",
  bait.name = "Bait",
  fixCoord = TRUE,
  triangular = FALSE
)
Arguments
- aggregatedMtx
: The matrix to plot. (Default NULL) - title
: The title of plot. (Default NULL) - trim
: A number between 0 and 100 that gives the percentage of trimming. (Default 0) - tails
: Which boundary must be trimmed? If it's both, trim half of the percentage in inferior and superior. see QtlThreshold. (Default "both")- colMin
: Minimal value of Heatmap, force color range. If NULLautomatically find. (Default NULL)- colMid
: Center value of Heatmap, force color range. If NULLautomatically find. (Default NULL)- colMax
: Maximal value of Heatmap, force color range. If NULLautomatically find. (Default NULL)- colBreaks
: Repartition of colors. If NULLautomatically find. (Default NULL)- blurPass
: Number of blur pass. (Default 0) - boxKernel
: If NULLautomatically compute for 3 Sd. (Default NULL)- kernSize
: Size of box applied to blurr. If NULLautomatically compute for 3 Sd. (Default NULL)- stdev
: SD of gaussian smooth. (Default 0.5) - loTri
: The value that replace all value in the lower triangle of matrice (Usefull when blur is apply).(Default NULL) - colors
: Heatmap color list. If NULL, automatically compute. (Default NULL)- na.value
: Color of NA values. (Default "#F2F2F2") - colorScale
: Shape of color scale on of "linear" or "density" based. (Default "linear") - bias
: A positive number. Higher values give more widely spaced colors at the high end. See ?grDevices::colorRampfor more details. (Default 1)- paletteLength
: The number of color in the palette. (Default 51) - annotate
: Should there be axis ticks? (Default: TRUE) - anchor.name
Name of anchor for annotation. (Default "Anchor") - bait.name
Name of bait for annotation. (Default "Bait") - fixCoord
Fix axes coordinates? (Default TRUE) - triangular
plot in a triangular format? available when matrices are extracted in "rf" mode only. (Default FALSE) (Default TRUE)
Examples
# Data
data(Beaf32_Peaks.gnr)
data(HiC_Ctrl.cmx_lst)
# Index Beaf32
Beaf32_Index.gnr <- IndexFeatures(
gRangeList = list(Beaf = Beaf32_Peaks.gnr),
chromSizes = data.frame(seqnames = c("2L", "2R"),
seqlengths = c(23513712, 25286936)),
binSize = 100000
)
# Beaf32 <-> Beaf32 Pairing
Beaf_Beaf.gni <- SearchPairs(indexAnchor = Beaf32_Index.gnr)
Beaf_Beaf.gni <- Beaf_Beaf.gni[seq_len(2000)]
# subset 2000 first for exemple
# Matrices extractions center on Beaf32 <-> Beaf32 point interaction
interactions_PF.mtx_lst <- ExtractSubmatrix(
genomicFeature = Beaf_Beaf.gni,
hicLst = HiC_Ctrl.cmx_lst,
referencePoint = "pf"
)
# Aggregate matrices in one matrix
aggreg.mtx <- Aggregation(interactions_PF.mtx_lst)
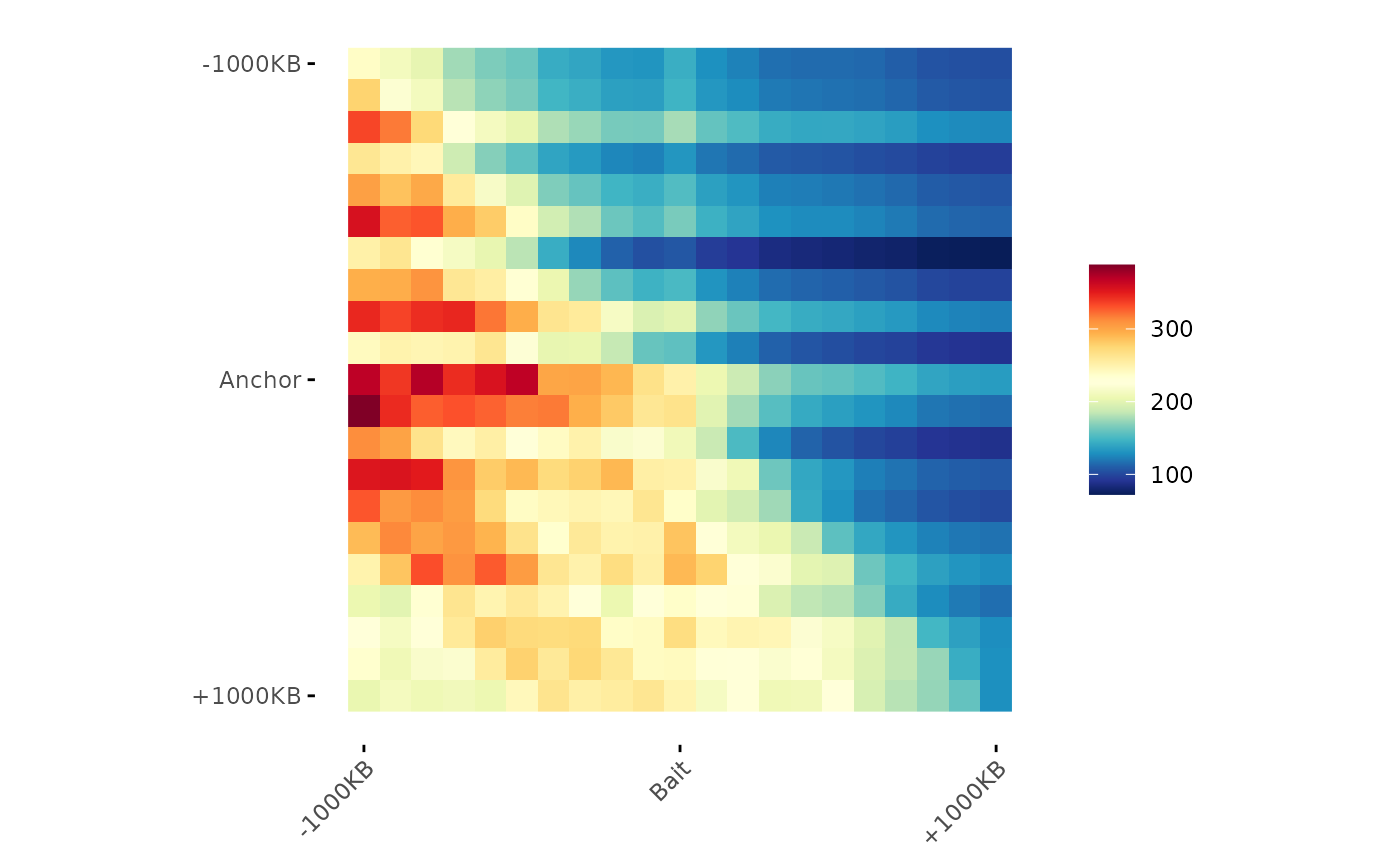
# Visualization
ggAPA(
aggregatedMtx = aggreg.mtx
)
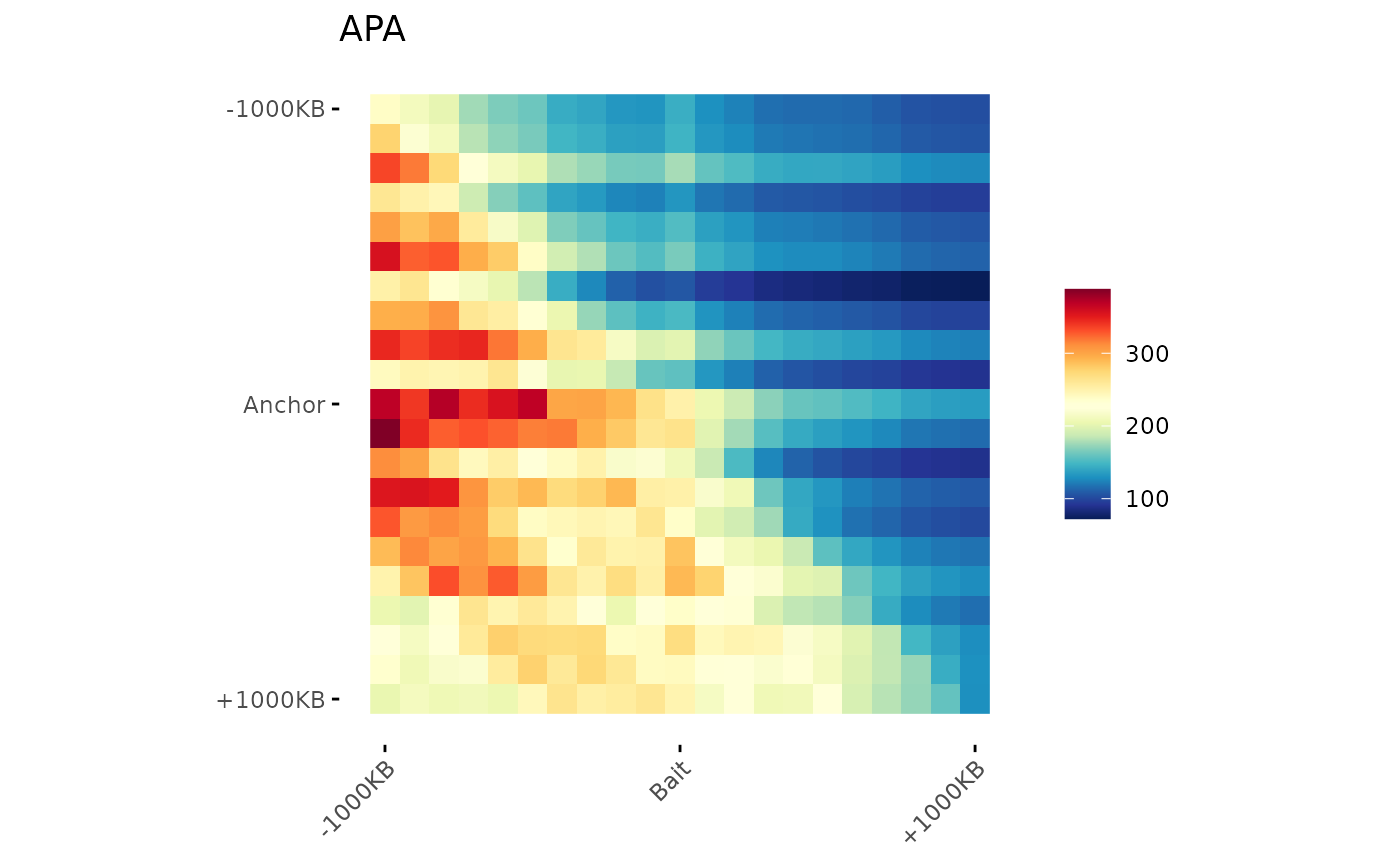
 # Add Title
ggAPA(
aggregatedMtx = aggreg.mtx,
title = "APA"
)
# Add Title
ggAPA(
aggregatedMtx = aggreg.mtx,
title = "APA"
)
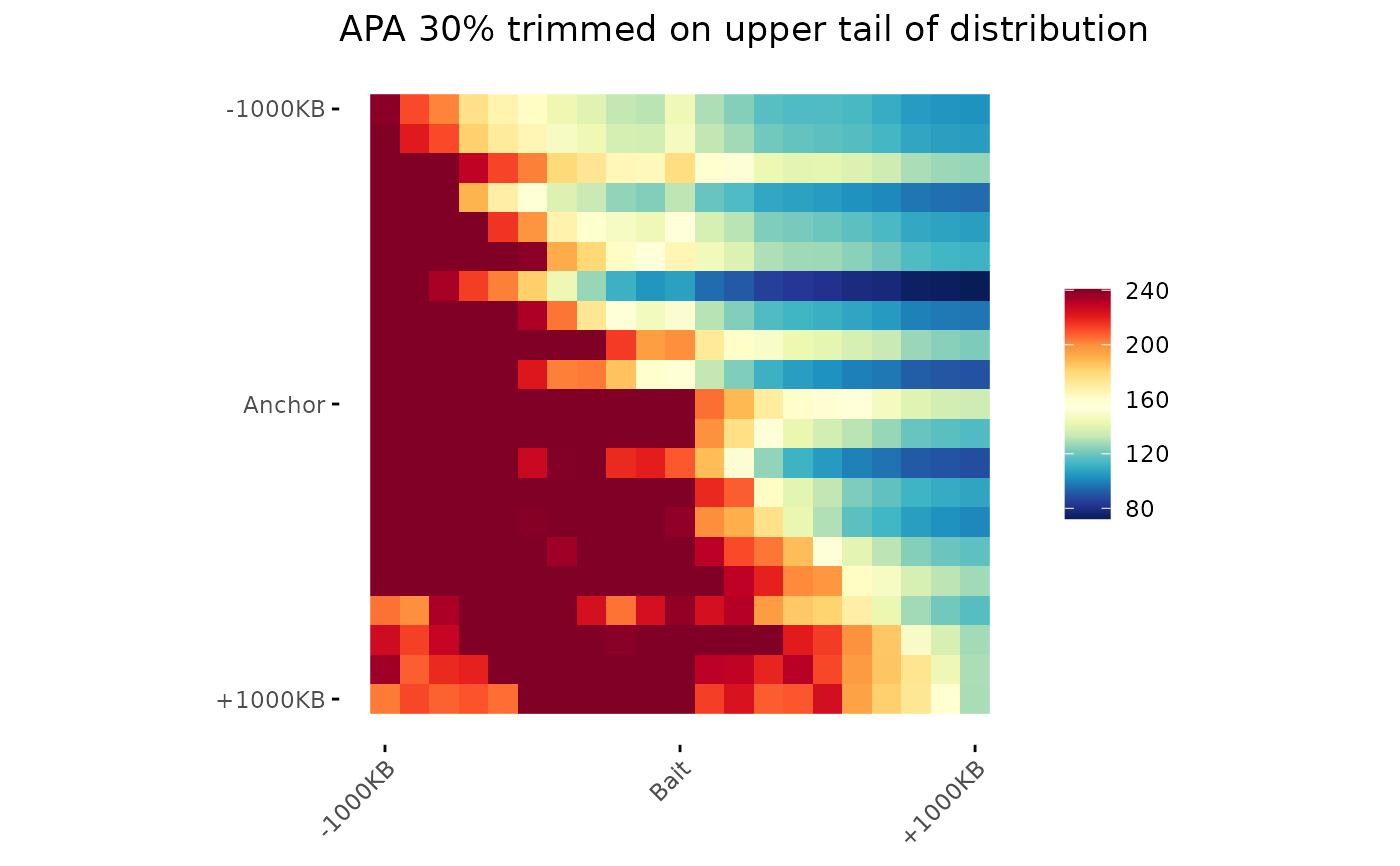
 # Trim values
ggAPA(
aggregatedMtx = aggreg.mtx,
title = "APA 30% trimmed on upper tail of distribution",
trim = 30,
tails = "upper"
)
#> Warning: no non-missing arguments to max; returning -Inf
# Trim values
ggAPA(
aggregatedMtx = aggreg.mtx,
title = "APA 30% trimmed on upper tail of distribution",
trim = 30,
tails = "upper"
)
#> Warning: no non-missing arguments to max; returning -Inf
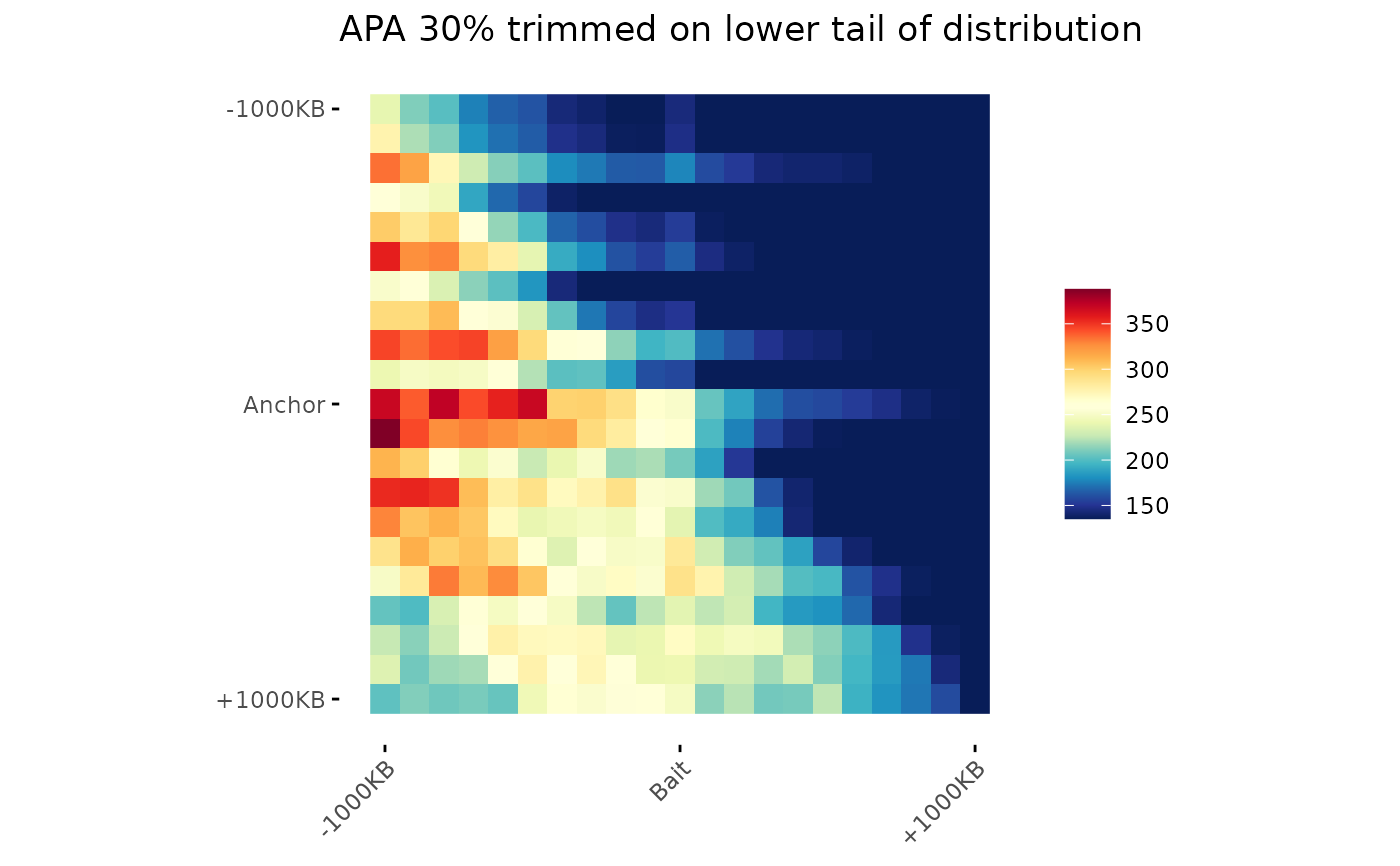
 ggAPA(
aggregatedMtx = aggreg.mtx,
title = "APA 30% trimmed on lower tail of distribution",
trim = 30,
tails = "lower"
)
#> Warning: no non-missing arguments to min; returning Inf
ggAPA(
aggregatedMtx = aggreg.mtx,
title = "APA 30% trimmed on lower tail of distribution",
trim = 30,
tails = "lower"
)
#> Warning: no non-missing arguments to min; returning Inf
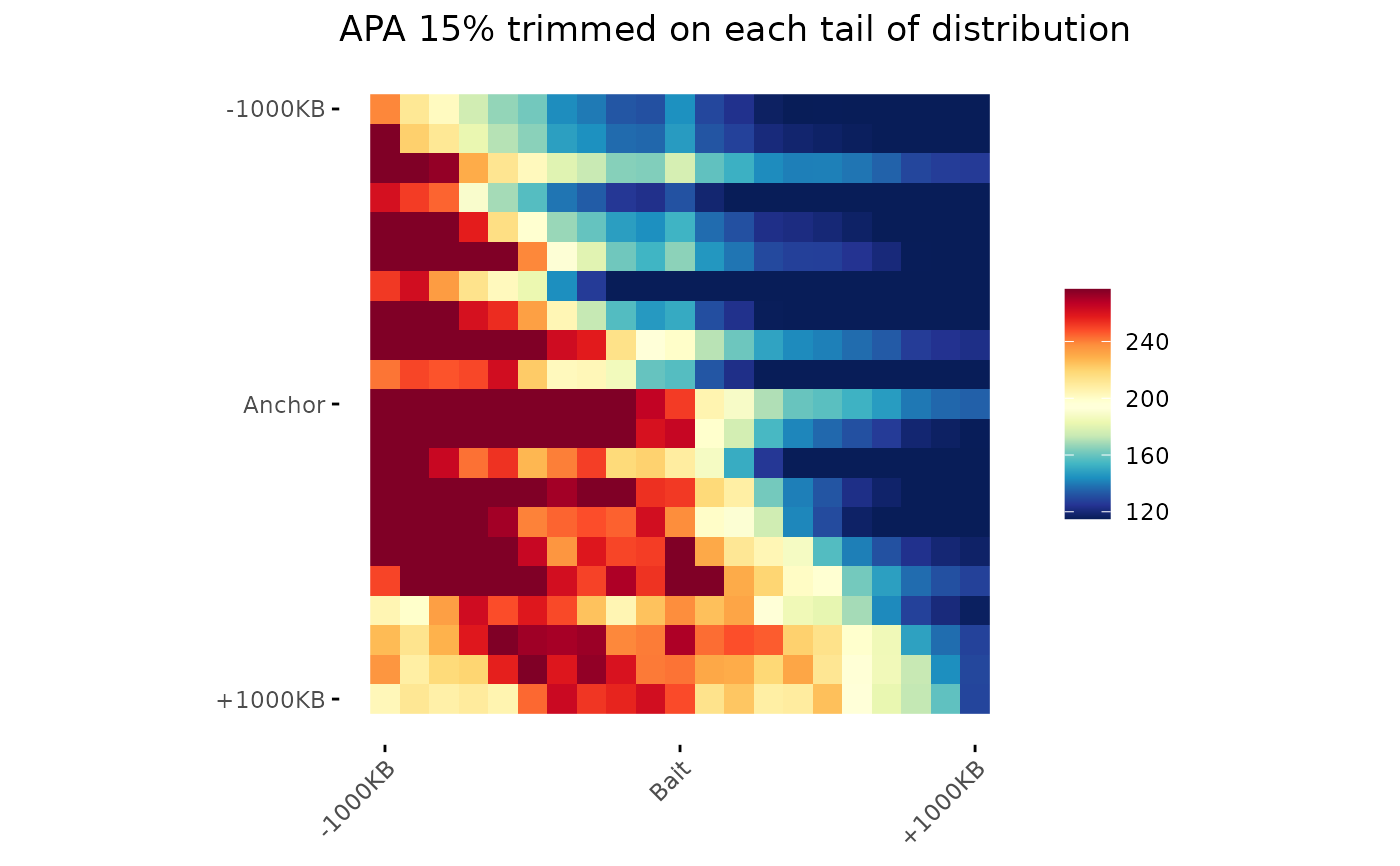
 ggAPA(
aggregatedMtx = aggreg.mtx,
title = "APA 15% trimmed on each tail of distribution",
trim = 30,
tails = "both"
)
ggAPA(
aggregatedMtx = aggreg.mtx,
title = "APA 15% trimmed on each tail of distribution",
trim = 30,
tails = "both"
)
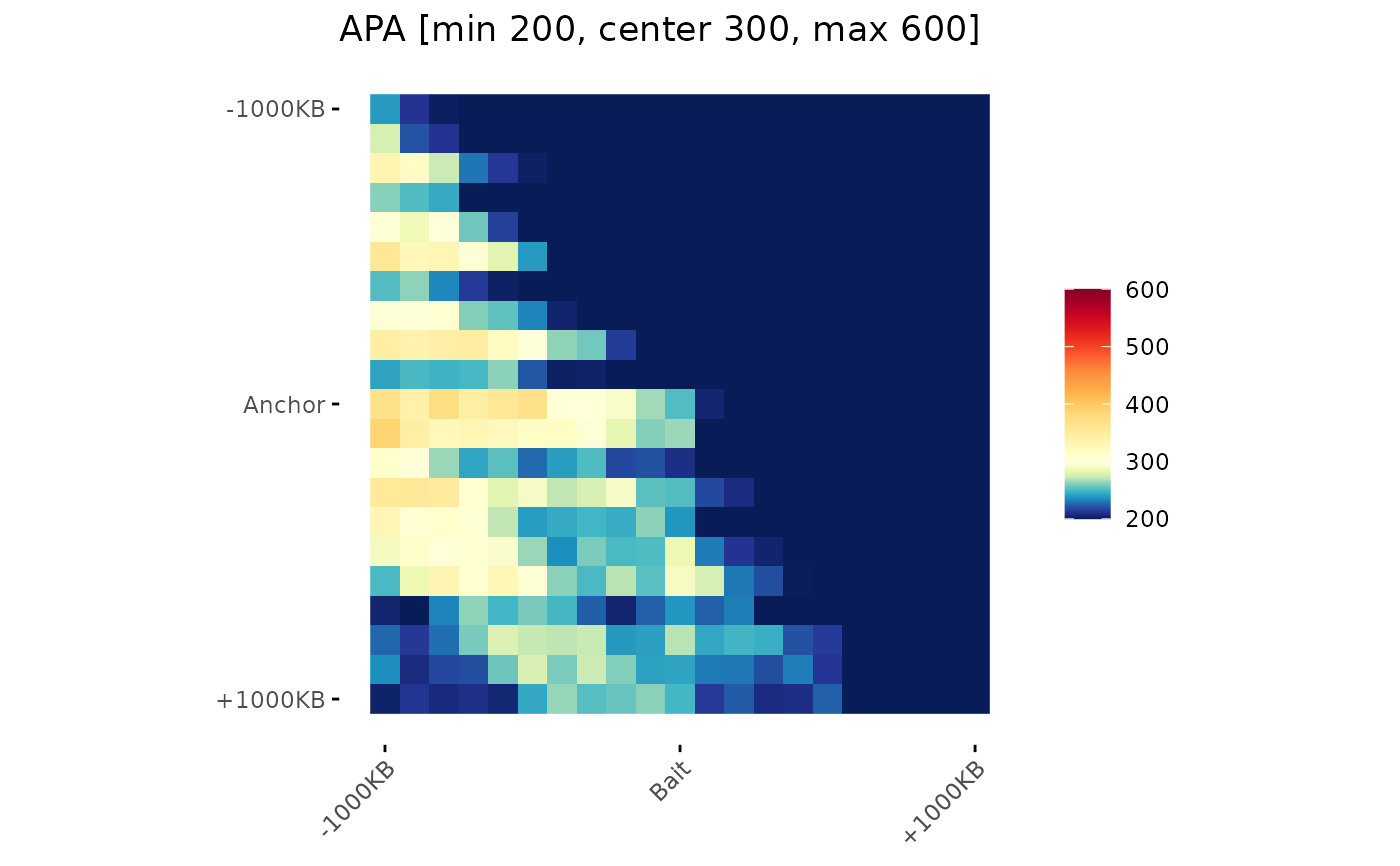
 # Change Minimal, Central and Maximal Colors scale value
ggAPA(
aggregatedMtx = aggreg.mtx,
title = "APA [min 200, center 300, max 600]",
colMin = 200,
colMid = 300,
colMax = 600
)
# Change Minimal, Central and Maximal Colors scale value
ggAPA(
aggregatedMtx = aggreg.mtx,
title = "APA [min 200, center 300, max 600]",
colMin = 200,
colMid = 300,
colMax = 600
)
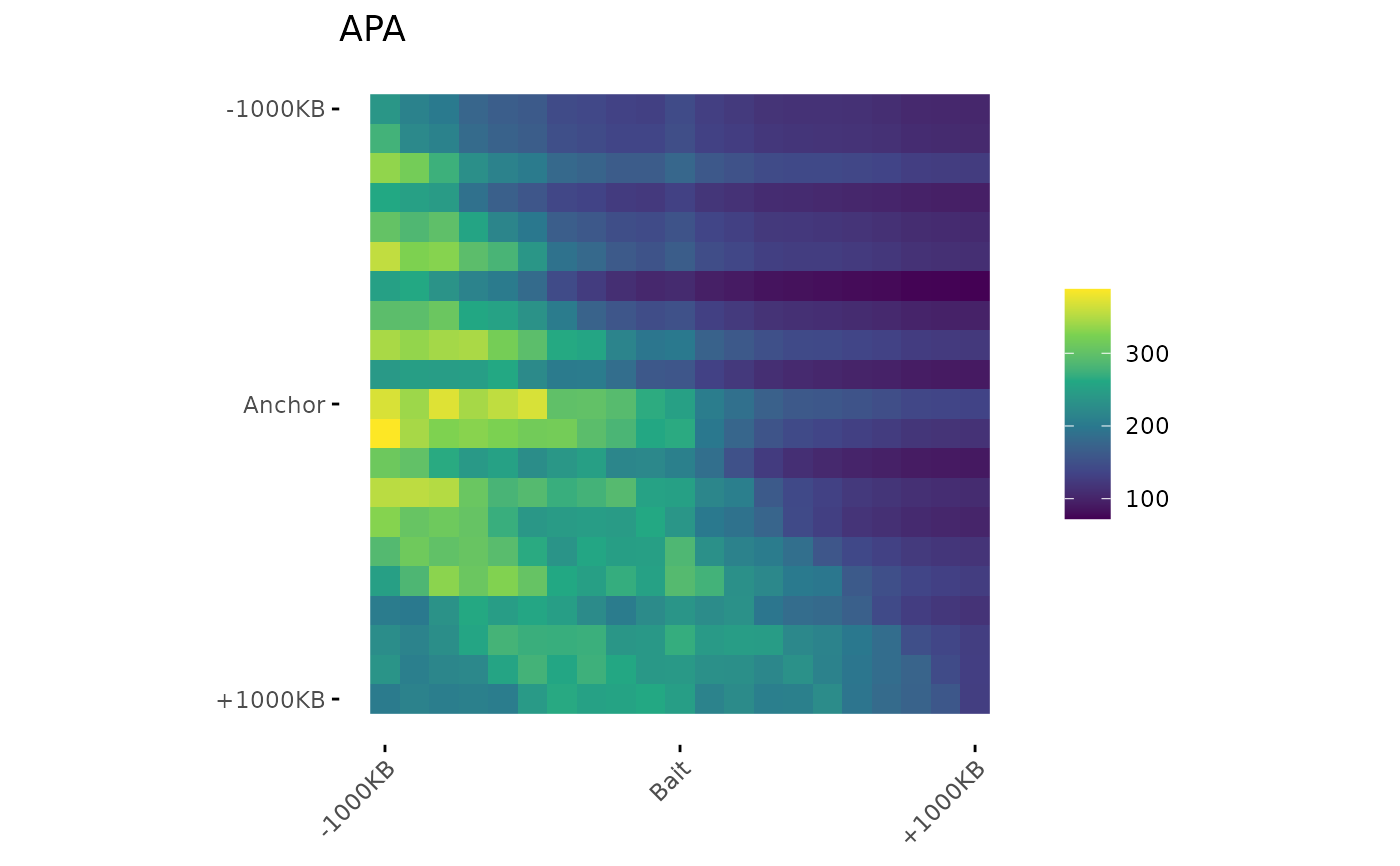
 # Change Color
ggAPA(
aggregatedMtx = aggreg.mtx,
title = "APA",
colors = viridis(6),
na.value = "black"
)
# Change Color
ggAPA(
aggregatedMtx = aggreg.mtx,
title = "APA",
colors = viridis(6),
na.value = "black"
)
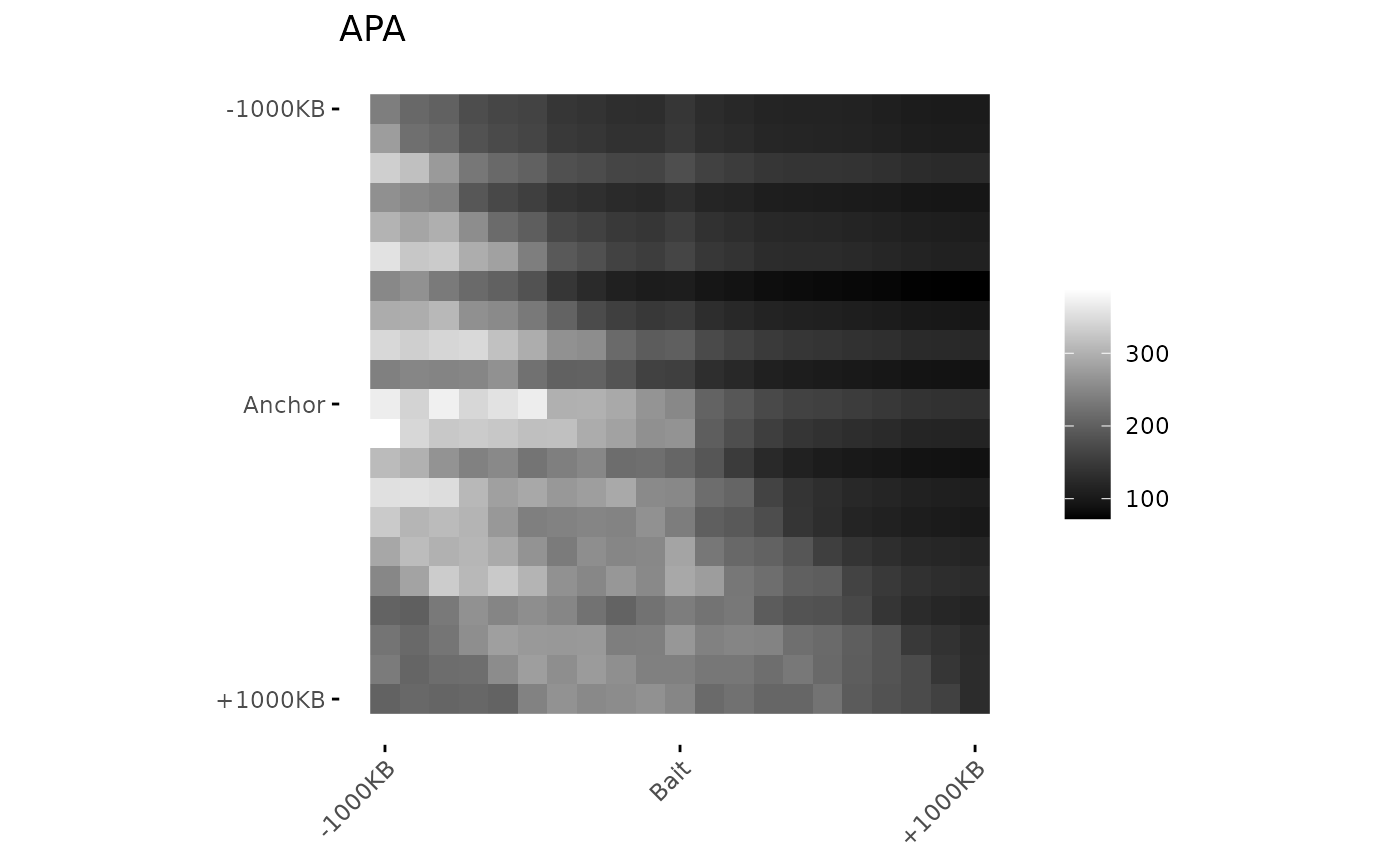
 ggAPA(
aggregatedMtx = aggreg.mtx,
title = "APA",
colors = c("black", "white"),
)
ggAPA(
aggregatedMtx = aggreg.mtx,
title = "APA",
colors = c("black", "white"),
)
 # Change Color distribution
ggAPA(
aggregatedMtx = aggreg.mtx,
title = "APA [100,150,200,250,300,350,600]",
colBreaks = c(100, 150, 200, 250, 300, 350, 600) # Choosen Breaks
)
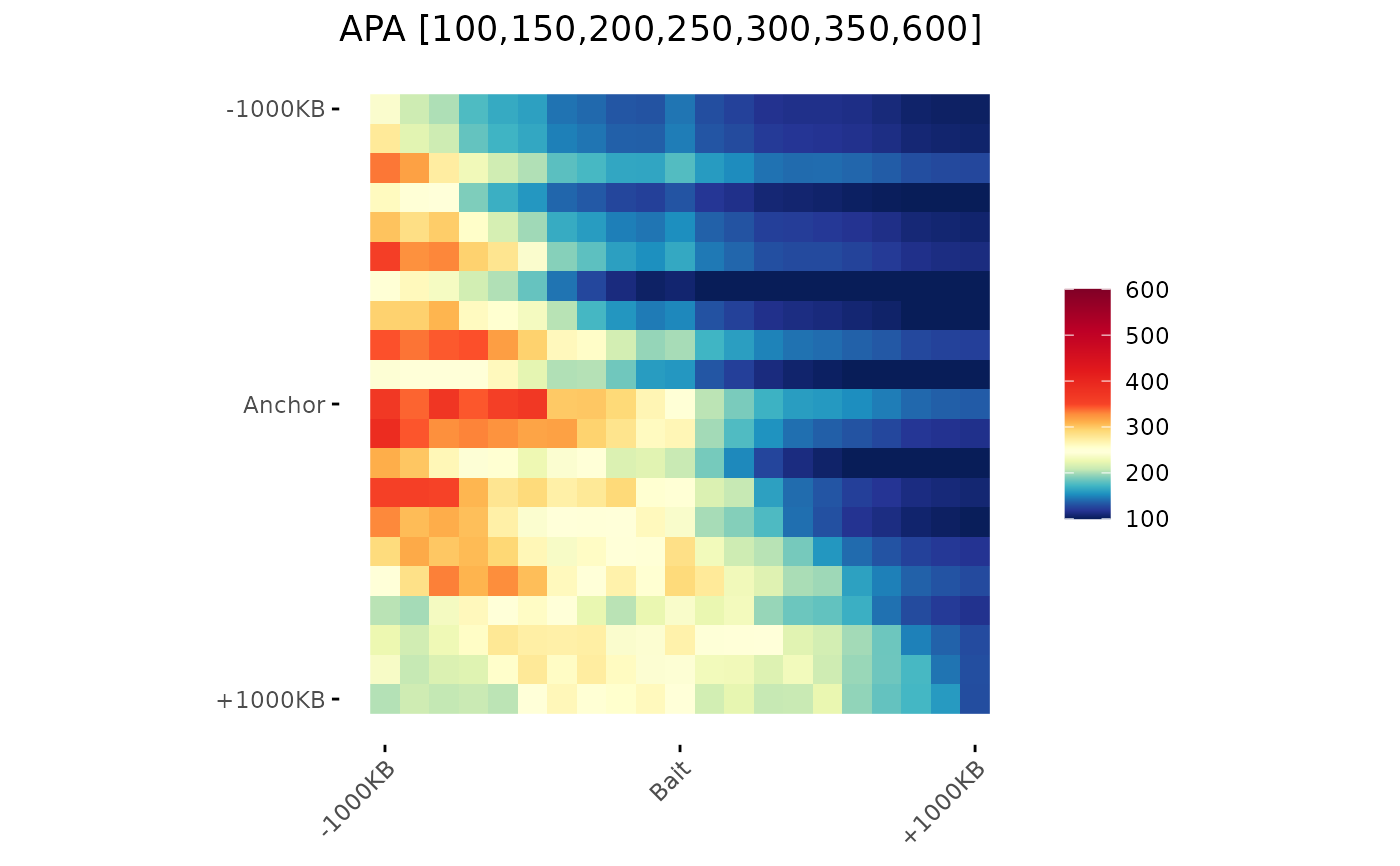
# Change Color distribution
ggAPA(
aggregatedMtx = aggreg.mtx,
title = "APA [100,150,200,250,300,350,600]",
colBreaks = c(100, 150, 200, 250, 300, 350, 600) # Choosen Breaks
)
 ggAPA(
aggregatedMtx = aggreg.mtx,
title = "APA",
colorScale = "density" # color distribution based on density
)
ggAPA(
aggregatedMtx = aggreg.mtx,
title = "APA",
colorScale = "density" # color distribution based on density
)
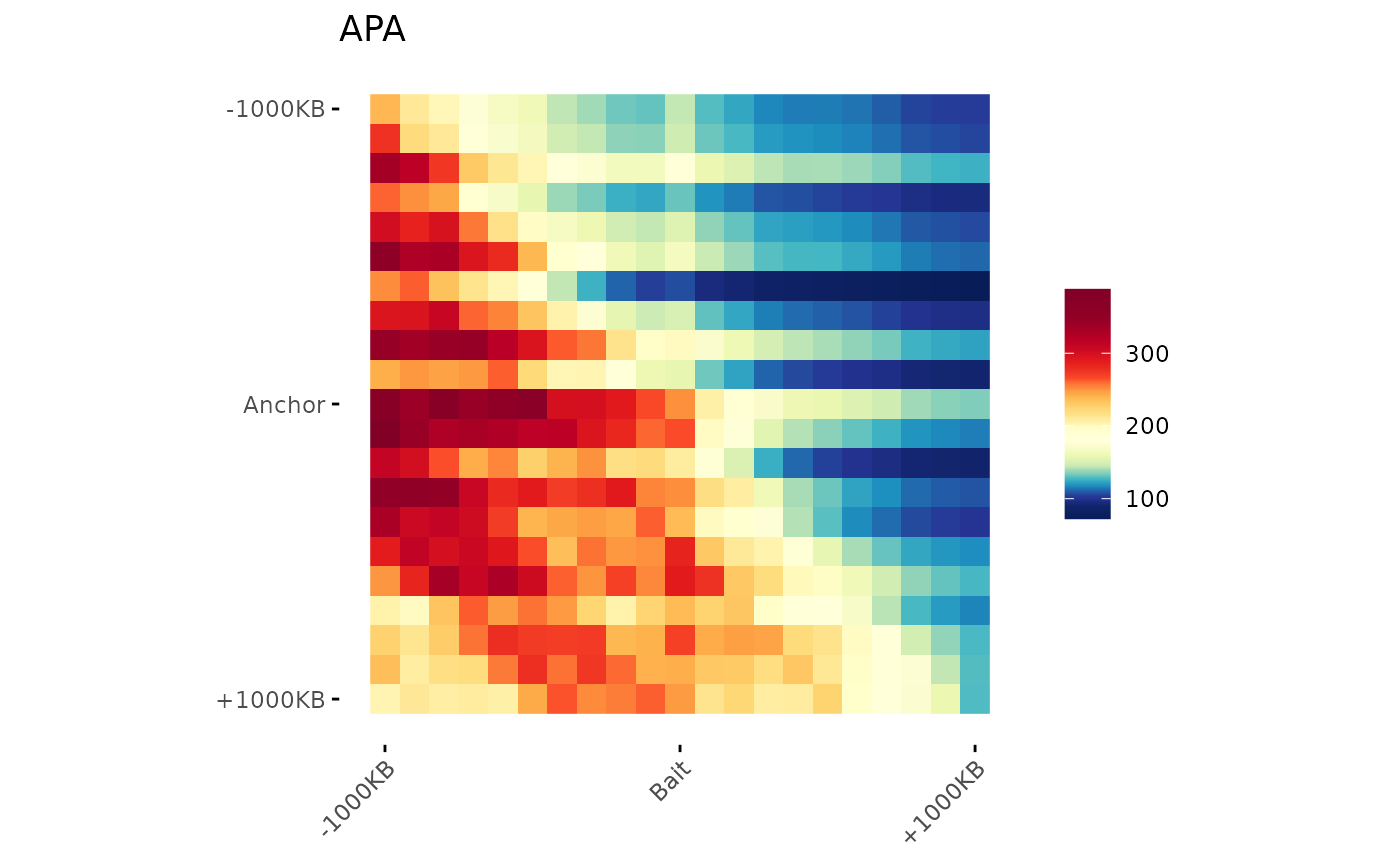 ggAPA(
aggregatedMtx = aggreg.mtx,
title = "APA",
bias = 2 # (>1 wait on extremums)
)
ggAPA(
aggregatedMtx = aggreg.mtx,
title = "APA",
bias = 2 # (>1 wait on extremums)
)
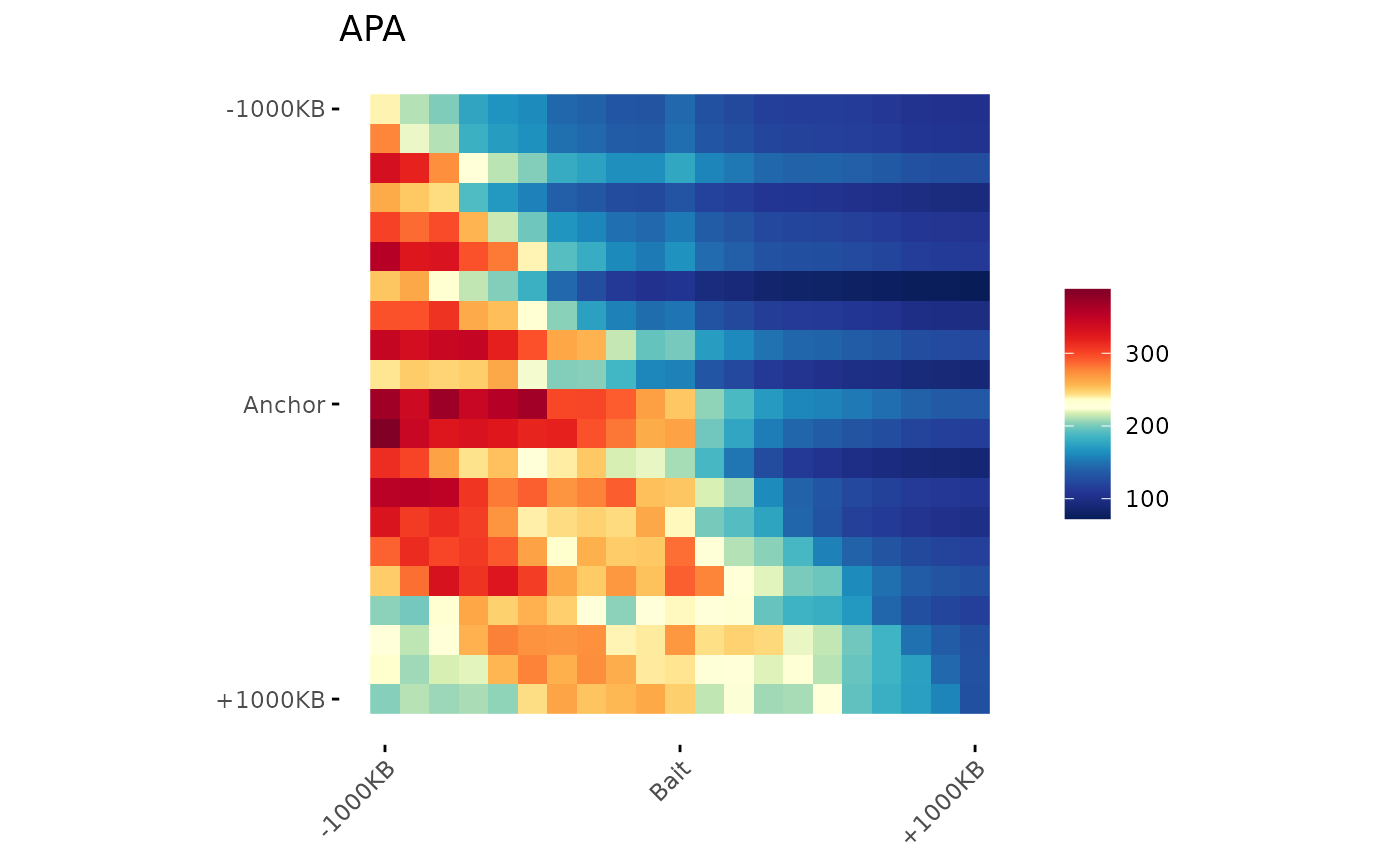 ggAPA(
aggregatedMtx = aggreg.mtx,
title = "APA",
bias = 0.5 # (<1 wait on center)
)
ggAPA(
aggregatedMtx = aggreg.mtx,
title = "APA",
bias = 0.5 # (<1 wait on center)
)
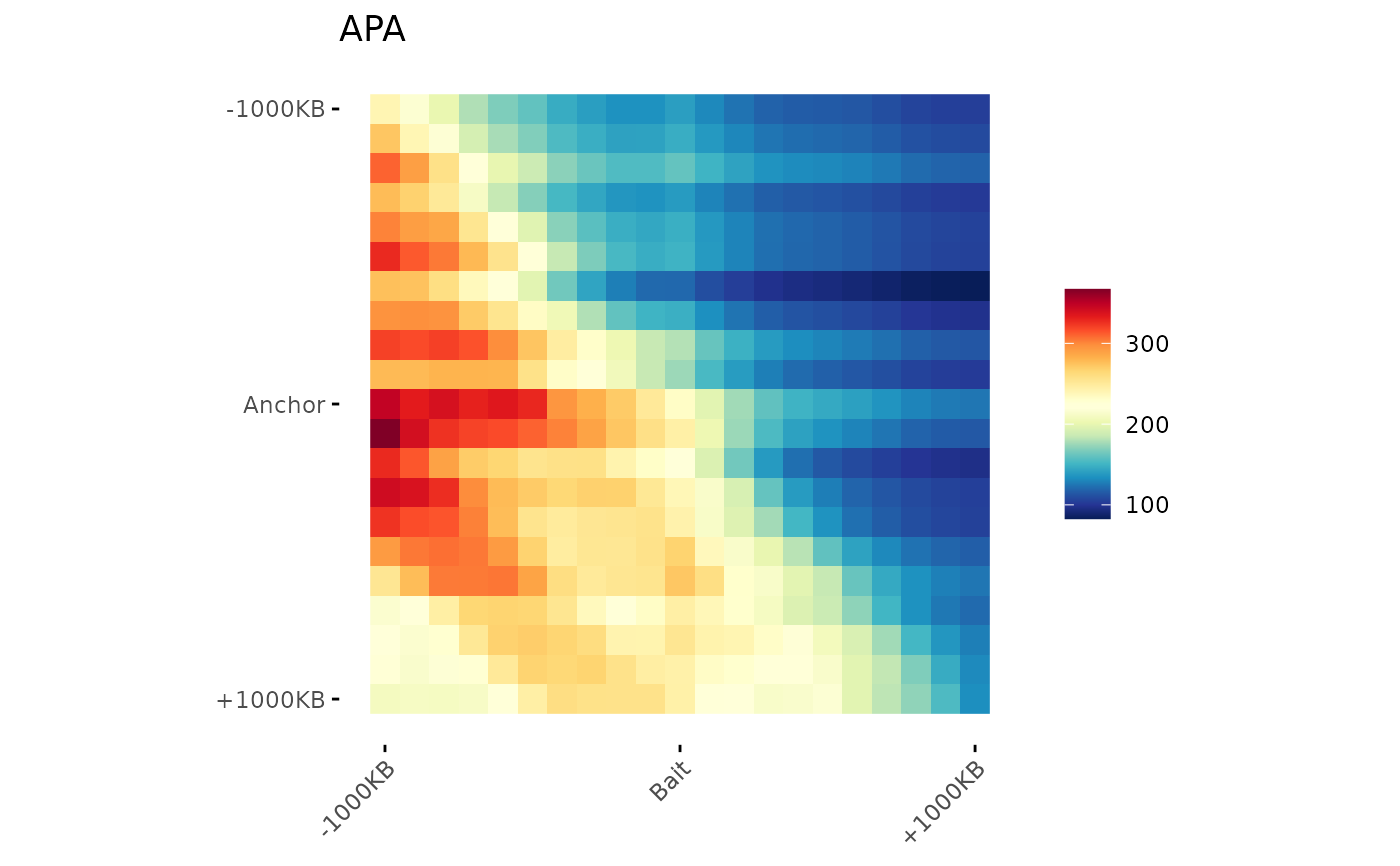
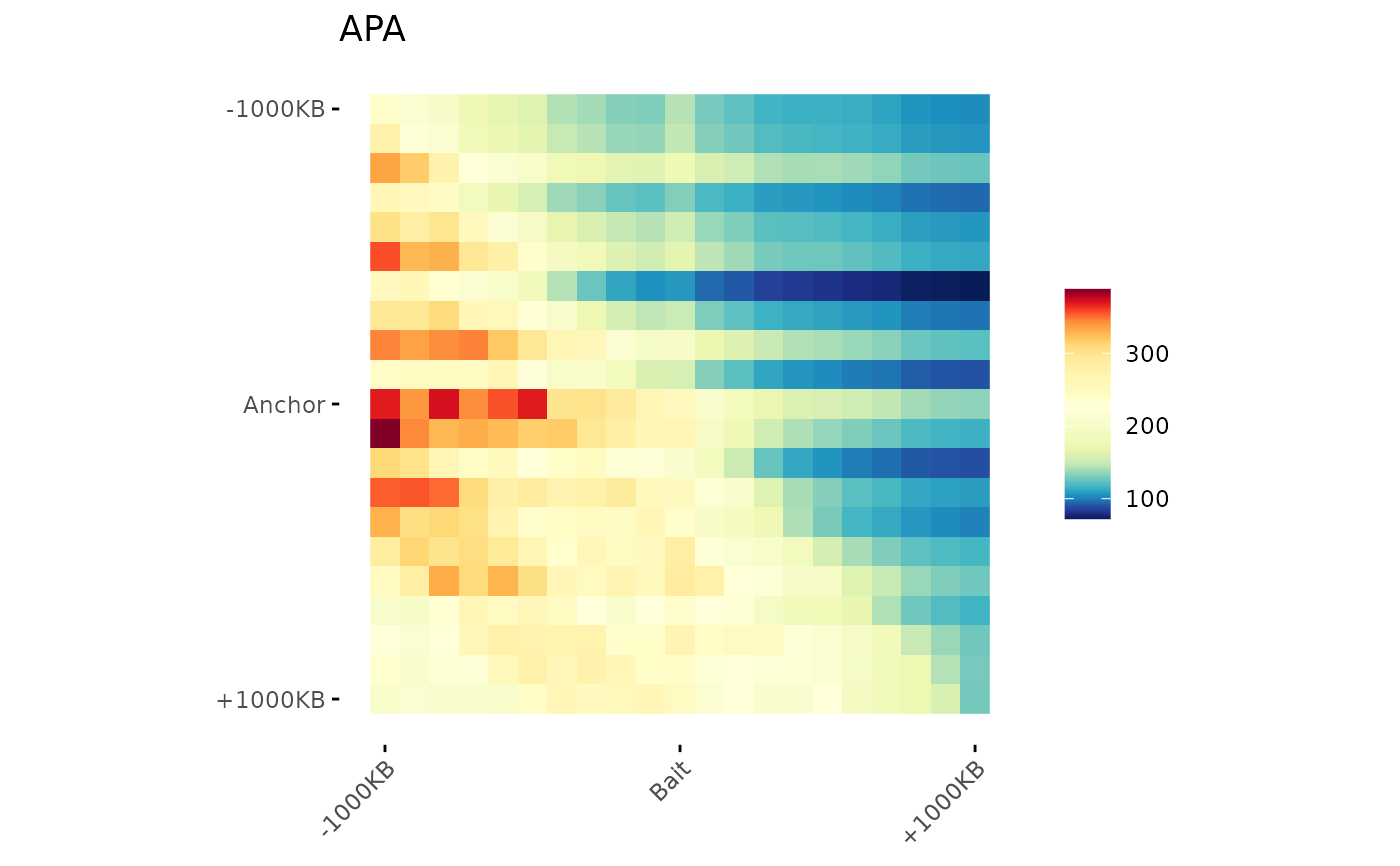 # Apply a Blurr
ggAPA(
aggregatedMtx = aggreg.mtx,
title = "APA",
blurPass = 1,
stdev = 0.5
)
# Apply a Blurr
ggAPA(
aggregatedMtx = aggreg.mtx,
title = "APA",
blurPass = 1,
stdev = 0.5
)
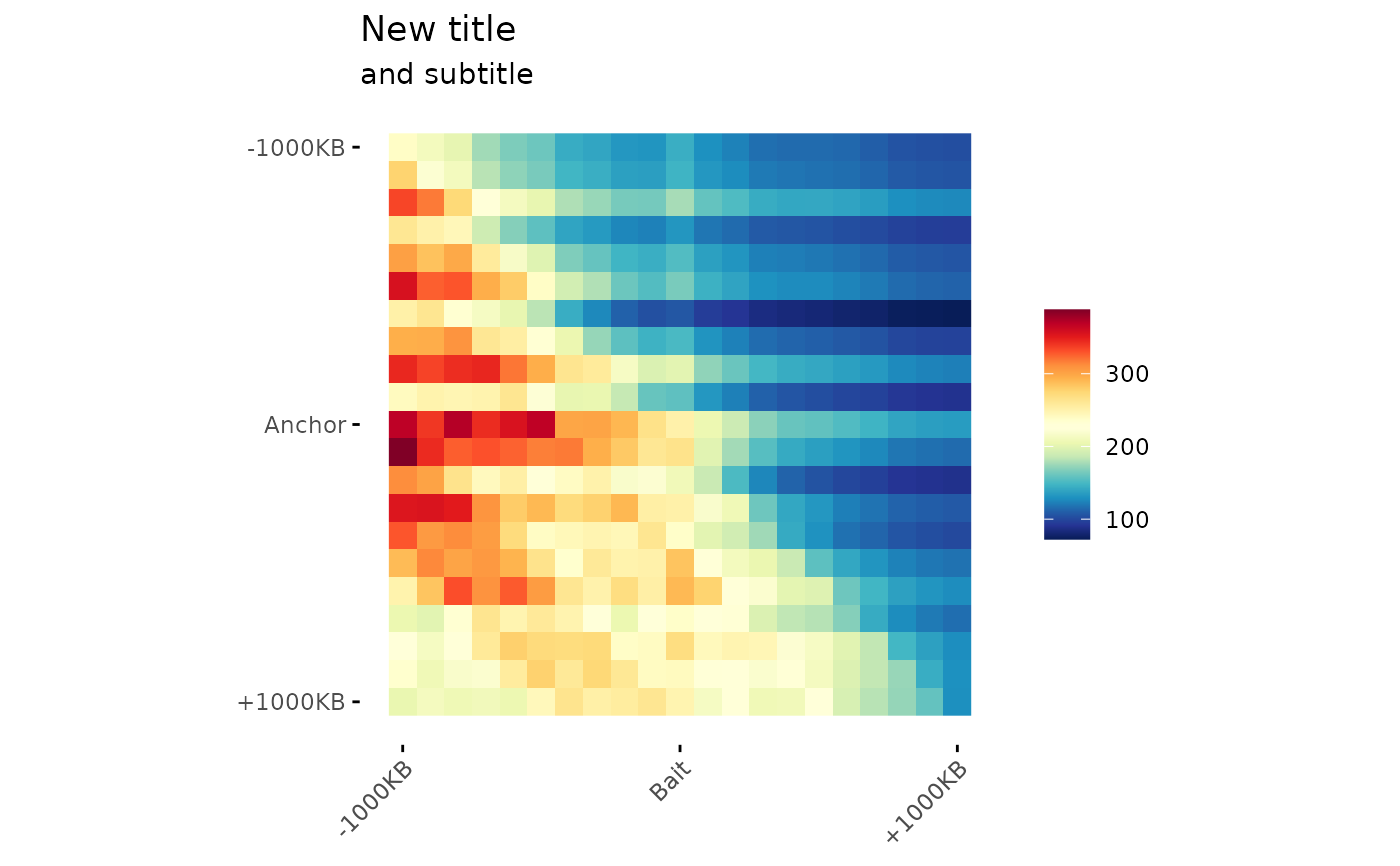
 # ggplot2 object modifications
# Since the function returns a ggplot object, it is possible
# to modify it following the ggplot2 grammar.
ggAPA(
aggregatedMtx = aggreg.mtx,
title = "APA",
) +
ggplot2::labs(
title = "New title",
subtitle = "and subtitle"
)
# ggplot2 object modifications
# Since the function returns a ggplot object, it is possible
# to modify it following the ggplot2 grammar.
ggAPA(
aggregatedMtx = aggreg.mtx,
title = "APA",
) +
ggplot2::labs(
title = "New title",
subtitle = "and subtitle"
)